On-chain Analysis

  • Difficulty Level: Advanced
  • Learning Duration: 45-60 minutes
On-chain Analysis

What Is On-Chain Analysis?

On-chain analysis is the study of blockchain data recorded directly on the ledger to understand how participants behave, how capital moves, and how conviction changes over time. Unlike technical analysis, which observes price behavior, on-chain analysis observes participant behavior. It answers questions such as:

  • Who is buying or selling?
  • Are long-term holders accumulating or distributing?
  • Is capital entering or leaving exchanges?
  • Is network activity expanding or contracting?

On-chain analysis does not provide precise entries or exits. It provides context, bias, and regime awareness.

What On-Chain Data Represents

Every on-chain metric originates from:

  • Wallet activity
  • Transaction history
  • Exchange flows
  • Network usage

Because blockchain data is public and verifiable, on-chain analysis reflects real behavior, not opinions or indicators derived from price alone. However, it must be interpreted carefully and never used in isolation.

Key Categories of On-Chain Analysis

Exchange Flows

What it measures:

  • Assets moving into exchanges
  • Assets moving out of exchanges

How to interpret:

  • Rising inflows → potential selling pressure
  • Rising outflows → potential accumulation or long-term holding

Advanced insight: Not all inflows mean selling. Some inflows are for derivatives collateral, arbitrage, or internal transfers. Context matters more than raw numbers.

Network Activity & Usage

Common metrics include:

  • Active addresses
  • Transaction count
  • Transaction volume

Interpretation:

  • Rising activity with rising price → healthy expansion
  • Falling activity with rising price → weak or speculative move

Network usage provides insight into adoption and demand, not short-term price direction.

Holder Behavior (Long-Term vs Short-Term)

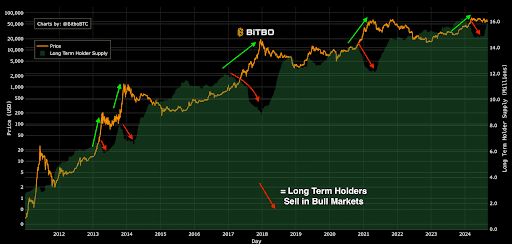
On-chain analysis often separates participants into:

  • Long-term holders (LTHs) – low turnover, high conviction
  • Short-term holders (STHs) – high turnover, reactive behavior

Typical observations:

  • LTH accumulation often occurs during prolonged weakness
  • STH distribution often increases during strong price expansions

This helps identify structural accumulation vs speculative activity.

Profitability Metrics (Realized Behavior)

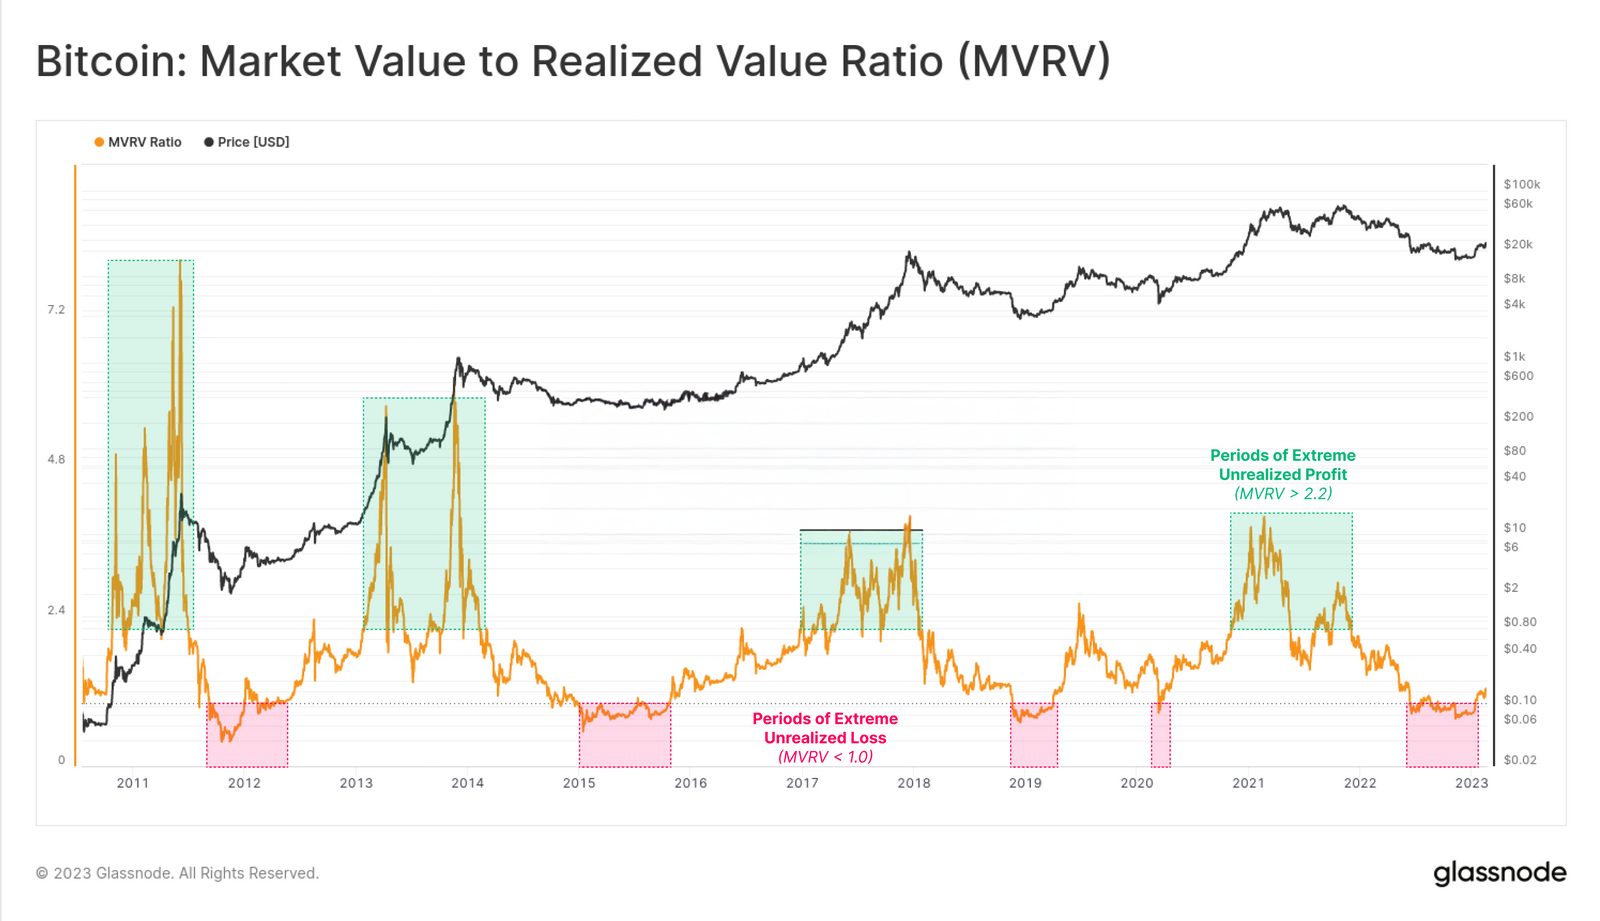
These metrics assess whether participants are:

  • In profit
  • At breakeven
  • In loss

Common interpretations:

  • High profitability → increased incentive to sell
  • Widespread losses → reduced selling pressure, potential capitulation

Advanced traders use these to understand market stress, not to time trades.

On-Chain vs Technical Analysis

Aspect On-Chain Analysis Technical Analysis
Focus Participant behavior Price behavior
Time horizon Medium to long term Short to medium term
Precision Low High
Strength Context & conviction Execution & timing
Weakness Slow reaction Noise sensitivity

The strongest analysis comes from combining both, not choosing one.

Market Regimes and On-Chain Context

On-chain analysis is most effective for identifying market regimes:

  • Accumulation phases
  • Distribution phases
  • Euphoria and excess
  • Capitulation and exhaustion

These phases often develop before they are visible on price charts.On-chain data helps traders adjust expectations, not chase moves.

Common Misunderstandings in On-Chain Analysis

  • Treating on-chain metrics as buy/sell signals
  • Ignoring time lag in blockchain data
  • Overfitting conclusions to single metrics
  • Assuming causation instead of correlation

On-chain data reflects behavior, not intent.

Limitations of On-Chain Analysis

On-chain analysis has important limitations:

  • Not all transactions represent economic activity
  • Exchange internal transfers distort data
  • Derivatives activity is largely off-chain
  • Short-term trading signals are unreliable

Because of this, on-chain analysis should guide bias, not entries.

How Advanced Traders Use On-Chain Data

  • Confirm or challenge price narratives
  • Identify accumulation or distribution phases
  • Adjust position sizing and risk exposure
  • Align trades with broader market conditions

It is a strategic tool, not a tactical one.

Key Takeaways

  • On-chain analysis studies real participant behavior
  • It provides context, not trade signals
  • Exchange flows and holder behavior are core metrics
  • On-chain data works best on higher timeframes
  • Combining on-chain with technical analysis improves decision quality

On-chain analysis helps traders understand who is acting, why they may act, and how conviction changes over time — which is critical for advanced decision-making.