Live Examples with Bitcoin and Major Pairs

  • Difficulty Level: Intermediate
  • Learning Duration: 30-40 minutes

Why Live Examples Matter

Indicators make more sense when seen in real market conditions, not in isolation.

Bitcoin and major trading pairs:

  • Have high liquidity
  • Reflect real market psychology
  • Are less affected by random manipulation

This makes them ideal for learning how indicators behave in practice, not just in theory.

What This Tells Us

  • The market is in an uptrend
  • Buyers are in control
  • EMAs are acting as dynamic support

How Traders Use This

  • Avoid short (sell) trades
  • Look for buying opportunities on pullbacks
  • Place risk below the EMA zone

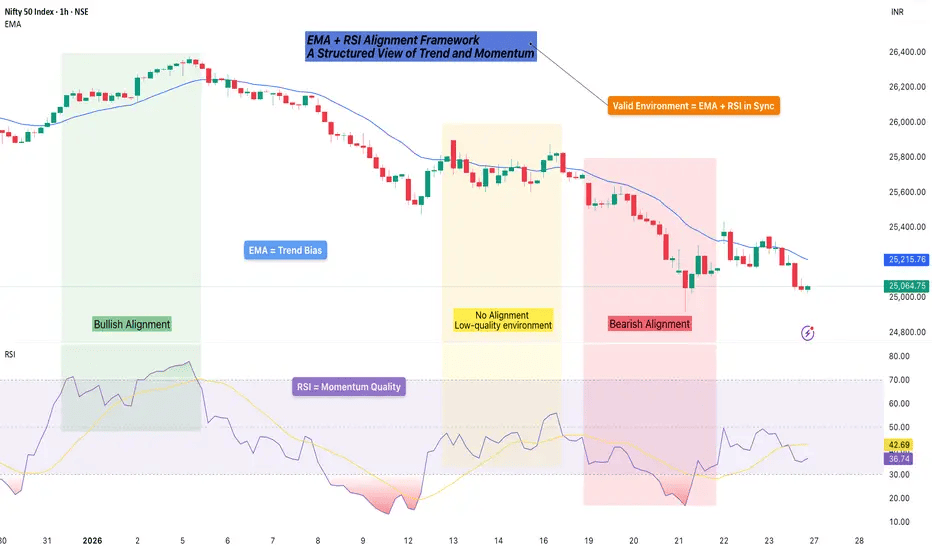
Key idea: EMAs help define direction, not exact entry points.

Example 1: Bitcoin (BTC) - Using EMAs to Identify Trend

What We Observe

  • Price stays above the 50 EMA
  • The 20 EMA stays above the 50 EMA
  • Pullbacks respect the EMA zone

Example 2: Bitcoin (BTC) - RSI During Strong Trends

What We Observe

  • RSI stays between 50 and 70
  • RSI does not drop into oversold territory
  • Momentum remains strong

Common Beginner Mistake

Assuming: "RSI is near 70, price must fall"

Reality

  • RSI can stay elevated for long periods
  • Overbought does not mean reversal
  • RSI shows strength, not exhaustion

Key idea: RSI should be read with trend context, not as a reversal signal.

Example 3: Bitcoin (BTC) MACD Momentum Shift

What We Observe

  • MACD line crosses above signal line
  • Histogram turns positive
  • Price starts expanding upward

What This Indicates

  • Momentum is shifting upward
  • Trend strength is increasing
  • Buyers are becoming more aggressive

How Traders Use This

  • Confirm trend continuation
  • Avoid late entries during weakening momentum
  • Combine with structure or EMA support

MACD works best when confirming existing direction, not predicting reversals.

Example 4: ETH/USDT - Combining EMAs and RSI

Market Condition

  • Price above 20 EMA
  • Price above 50 EMA
  • RSI remains above 50

Interh4retation

  • Trend is bullish
  • Momentum supports continuation
  • Pullbacks are likely corrective

Trading Logic (Not Advice)

  • Trend-following bias
  • No counter-trend trades
  • Risk defined below recent structure

Example 5: Major Pair in Range - Indicators Can Mislead

What We Observe

  • Price moving sideways
  • EMAs crossing frequently
  • RSI oscillating between 40-60
  • MACD producing false signals

What This Teaches

  • Indicators struggle in range-bound markets
  • Frequent signals ≠ good signals
  • Context matters more than indicators

Lesson: Indicators perform best when the market has direction and liquidity.

Bitcoin vs Altcoin Behavior

  • Liquidity: Bitcoin - very high | Altcoins - varies
  • Indicator reliability: higher on Bitcoin
  • Fake signals: fewer on Bitcoin
  • Trend clarity: clearer on Bitcoin

This is why Bitcoin is often used as a learning reference market.

How to Practice This Yourself

  • Open a BTC or ETH chart
  • Add 20 EMA and 50 EMA
  • Add RSI (14)
  • Add MACD (default)
  • Ask if the market is trending or ranging
  • Check if indicators confirm price

Do not try to predict. Focus on reading what the market is already showing.

Key Takeaways

  • Indicators behave differently in trends vs ranges
  • Bitcoin provides cleaner learning examples
  • RSI shows momentum, not guaranteed reversals
  • EMAs define direction, not entries
  • MACD confirms strength, not perfect timing
  • Live examples teach behavior, not formulas